Upstream Tech built Lens as an easy-to-use web app for organizations to use remote monitoring to support their forest management needs. Read on for examples of how Lens can inform forest management, including use cases from the Society for the Protection of New Hampshire Forests, the Sonoma Land Trust, and Colorado Open Lands. Or, use the outline below to quickly reference the Lens use cases that interest you.

Upstream Tech built Lens as an easy-to-use web app for organizations to use remote monitoring to support their forest management needs. Read on for examples of how Lens can inform forest management, including use cases from the Society for the Protection of New Hampshire Forests, the Sonoma Land Trust, and Colorado Open Lands.
Healthy forests provide critical habitat to support biodiversity, improve air quality, filter and retain water, and store carbon. Yet in the face of a rapidly changing climate, managers need new tools to ensure that forests remain resilient and continue providing these benefits. Accurate and timely data is essential to make informed decisions about how best to steward and protect forestland. Further, transparency and oversight is critical for organizations that need to monitor forests under conservation easements or sustainable certification standards.

Lens provides accessible and affordable analytical tools for federal and state agencies, land trusts, NGOs, and forestry companies to remotely monitor changes on forested landscapes. Lens users can access the latest ecological analysis tools and satellite and aerial data to track dynamic forest conditions over time and across large geographies. From monitoring management activities such as harvests to tracking ecological events like fires or pest outbreaks, Lens enables organizations to effectively monitor and conserve forests.
From establishing baseline conditions to tracking planned management activities and easement violations, there are several ways that Lens can be integrated into forest management planning.
Organizations can use Lens to get a better understanding of how an area has looked over the past several years, depending on imagery that is available. When acquiring a forested property or working with a landowner to improve stewardship, it’s important to have an understanding of how the area has been managed in the past and its current condition. Unfortunately, a property’s seller or current landowner might not always know the property’s history or it may be difficult to verify the information they share.
Lens can be used to set baselines and corroborate information from landowners with archived or historic imagery and ongoing data from public sources. Organizations can use the information in Lens to cross reference what they’ve learned from the landowner or validate what makes the property high value for conservation.
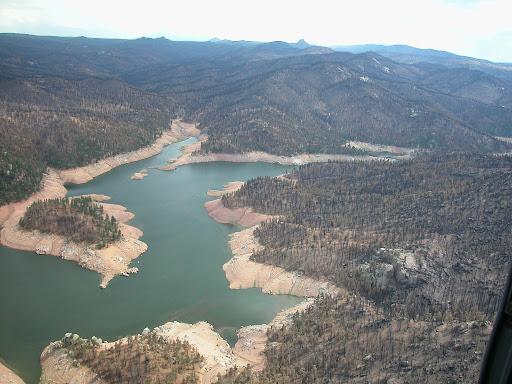
Lens reveals how flooding from a beaver dam changed this forested area over three years. Lens displaying imagery from Society for the Protection of New Hampshire Forests, 2019 (left), and Nearmap 2020 imagery (right).
Each year, Lens users can review imagery to ensure there have been no potential violations on their forested properties. The Society for the Protection of New Hampshire Forests (SPNHF) uses Lens to monitor the 200,000 acres they protect across the state. Among other things, they use Lens to ensure that no new structures or roads have been built on conservation lands without permission and that there has not been improper removal of trees.
In the below imagery, SPNHF used the Lens Compare mode to detect what may be debris placed on this property in a potential violation of its conservation easement.
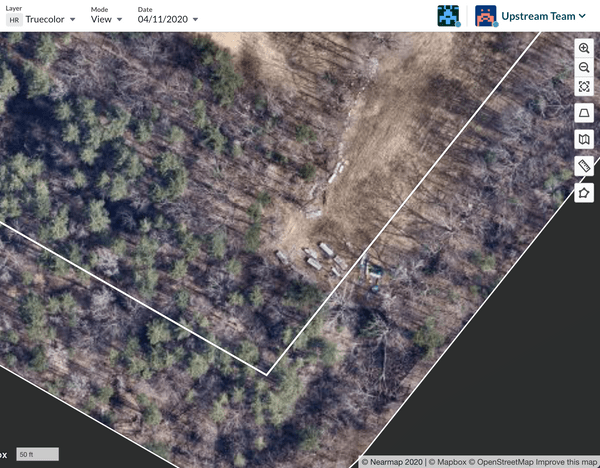
On a different property, SPNHF identified another possible conservation easement violation: the removal of a tree and a driveway expansion that is potentially within the property’s boundary (denoted by the white line).
Lens displaying imagery from Nearmap, 2019 & 2021
If there has been a cutting or timber harvest, Lens can be used to make sure it’s within the allowable terms and boundaries of an easement, forest management plan, or sustainable certification standard. This provides transparency and oversight for how the forestland is being managed, even in remote and hard-to-access locations. By viewing imagery taken after the harvest date, Lens users can quickly ensure that harvests were performed appropriately and on schedule without having to visit the site in-person.
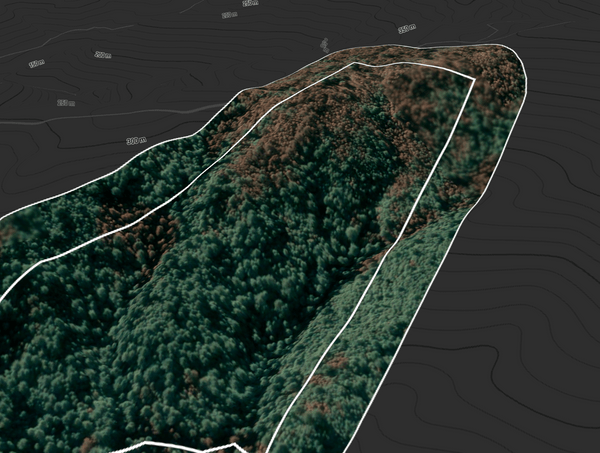
Lens can further be used to distinguish between different forest harvest practices. The image below, taken after a timber harvest, shows a clear differentiation between a thinning cut (upper portion) and a clearcut (lower and right portions). The lower left forest remains intact.

Lens’ color infrared data layer provides additional clarity for assessing forest stand composition and health over large areas. Plants reflect near infrared and green light, while absorbing red. Since they reflect more near infrared than green, plant-covered land in Lens’ color infrared layer appears deep red. Denser plant growth is darker red.
The imagery below shows a mixed stand of hardwood and softwood trees (i.e. deciduous and coniferous trees). The left truecolor image displays what the environment naturally looks like to the human eye. While there is clearly some variation in tree types, it is difficult to discern. The right image displays the same forest in Lens’ infrared data layer. We can more easily identify conifers as they appear more grey, while deciduous trees - which have more photosynthetic activity - are bright red.

It can be difficult to quickly understand how major ecological changes, such as fire and pests, impact a forested landscape. Lens’s vegetation layer and Analyze Area tool offers a cost-effective way to track ecological changes across large areas, whether they unfold over the span of years, months, or even weeks.
As uncertainty and risks around wildfires increase with climate change, forest managers need new tools to rapidly assess the extent of wildfire impact to their land. The Sonoma Land Trust in northern California uses Lens to monitor the impacts of fires on their properties.
The below imagery was taken just months apart - in March and October of 2020. The later imagery from October shows the results of a wildfire that burned a portion of the property. Using Lens’ Analyze Area tool to measure vegetation vigor over time, Sonoma Land Trust can pinpoint the month where the fire occurred: the graph shows a steep drop off in vegetation vigor in August of 2020.
Lens displaying imagery from Airbus, 2020
Lens’ 3D mode gives an even better angle on the fire damage, and also helps to make inferences about the fire’s behavior. The above image reveals that a larger percentage of burned canopy occurred at the property’s higher elevations.
Lens’ vegetation layer provides a reliable way to evaluate vegetation health and changes over time, revealing where pests have damaged trees. This layer measures vegetation vigor using the Normalized Difference Vegetation Index (NDVI), which indicates photosynthetic activity based on red (visible) and near-infrared satellite data.
Colorado Open Lands, a statewide land trust, has used Lens’ vegetation layers to track tree damage caused by beetle outbreaks. The below image on the left shows a forested area that suffered a beetle outbreak. However, from the true color image, it is difficult to tell where damage occurred. The image on the right shows the same area displayed in Lens’ vegetation layer. Dark green signals healthy trees while yellow and orange indicates lower photosynthetic activity - marking where trees were impacted by the beetles.

The imagery below applies Lens’ vegetation layer and Compare mode in 3D mode to analyze an LDD (gypsy) moth outbreak over just a couple of weeks in Vermont. NDVI highlights the drastic change in vegetation health: in the earlier imagery from June 6th, we see mostly uniform dark green within the area selected by Lens’ Analyze Area tool (the yellow square), denoting high vegetation vigor. This is because these deciduous trees have fully leafed-out for the summer and are producing high photosynthetic activity. Contrast this to the large swathe of lighter green and yellow in the imagery taken only two and a half weeks later, which shows a significant drop in photosynthetic activity after the caterpillar outbreak munched off all of the trees’ leaves.
Lens displaying imagery from ESA Sentinel, 2021
Lens can also be used to remotely track forest regrowth. The true color image below on the left shows forest regrowth about six years after a clear cut occurred. The image on the right shows the same area with Lens’ vegetation layer. The white and orange illustrate where regrowth is slower to occur (as opposed to light and dark green, which denotes strong photosynthetic activity). Such variations are harder to parse out in the true color imagery. Forest managers can use this information to better understand regrowth patterns by targeting on-the-ground visits to areas of the property where regrowth is slower.

Large-scale analysis, aided by machine learning, can help organizations hone in on high risk areas or assess conservation values to inform interventions and actions. Upstream Tech partnered with Salo Sciences to display their AI-derived forest data layers in Lens. This data will provide new insights into factors such as wildfire risk, canopy coverage, canopy height, and more. Updated annually, it will empower Lens users to identify patterns and risks to inform management activities.
For example, below are Salo Science’s surface fuels data displayed in Lens. This data determines vegetation fuel type and moisture content (among other factors) to determine fire behavior patterns like flame rate and spread rate. Comparing the data from 2016 and 2018 shows how surface fuels - the dark red areas - have increased on this property, thus increasing the spread rate of a potential fire.

While currently only available for California, Salo Sciences is working to expand its coverage to other states, including Oregon and Washington in the coming months.
The accessibility of remote sensing data that Lens offers allows organizations to understand the forests they study, protect, and steward in a new way. If you’re interested in learning more about how Lens might work for your forest management needs, visit our plans page or book a demo. Please send any questions or comments to lens@upstream.tech.